
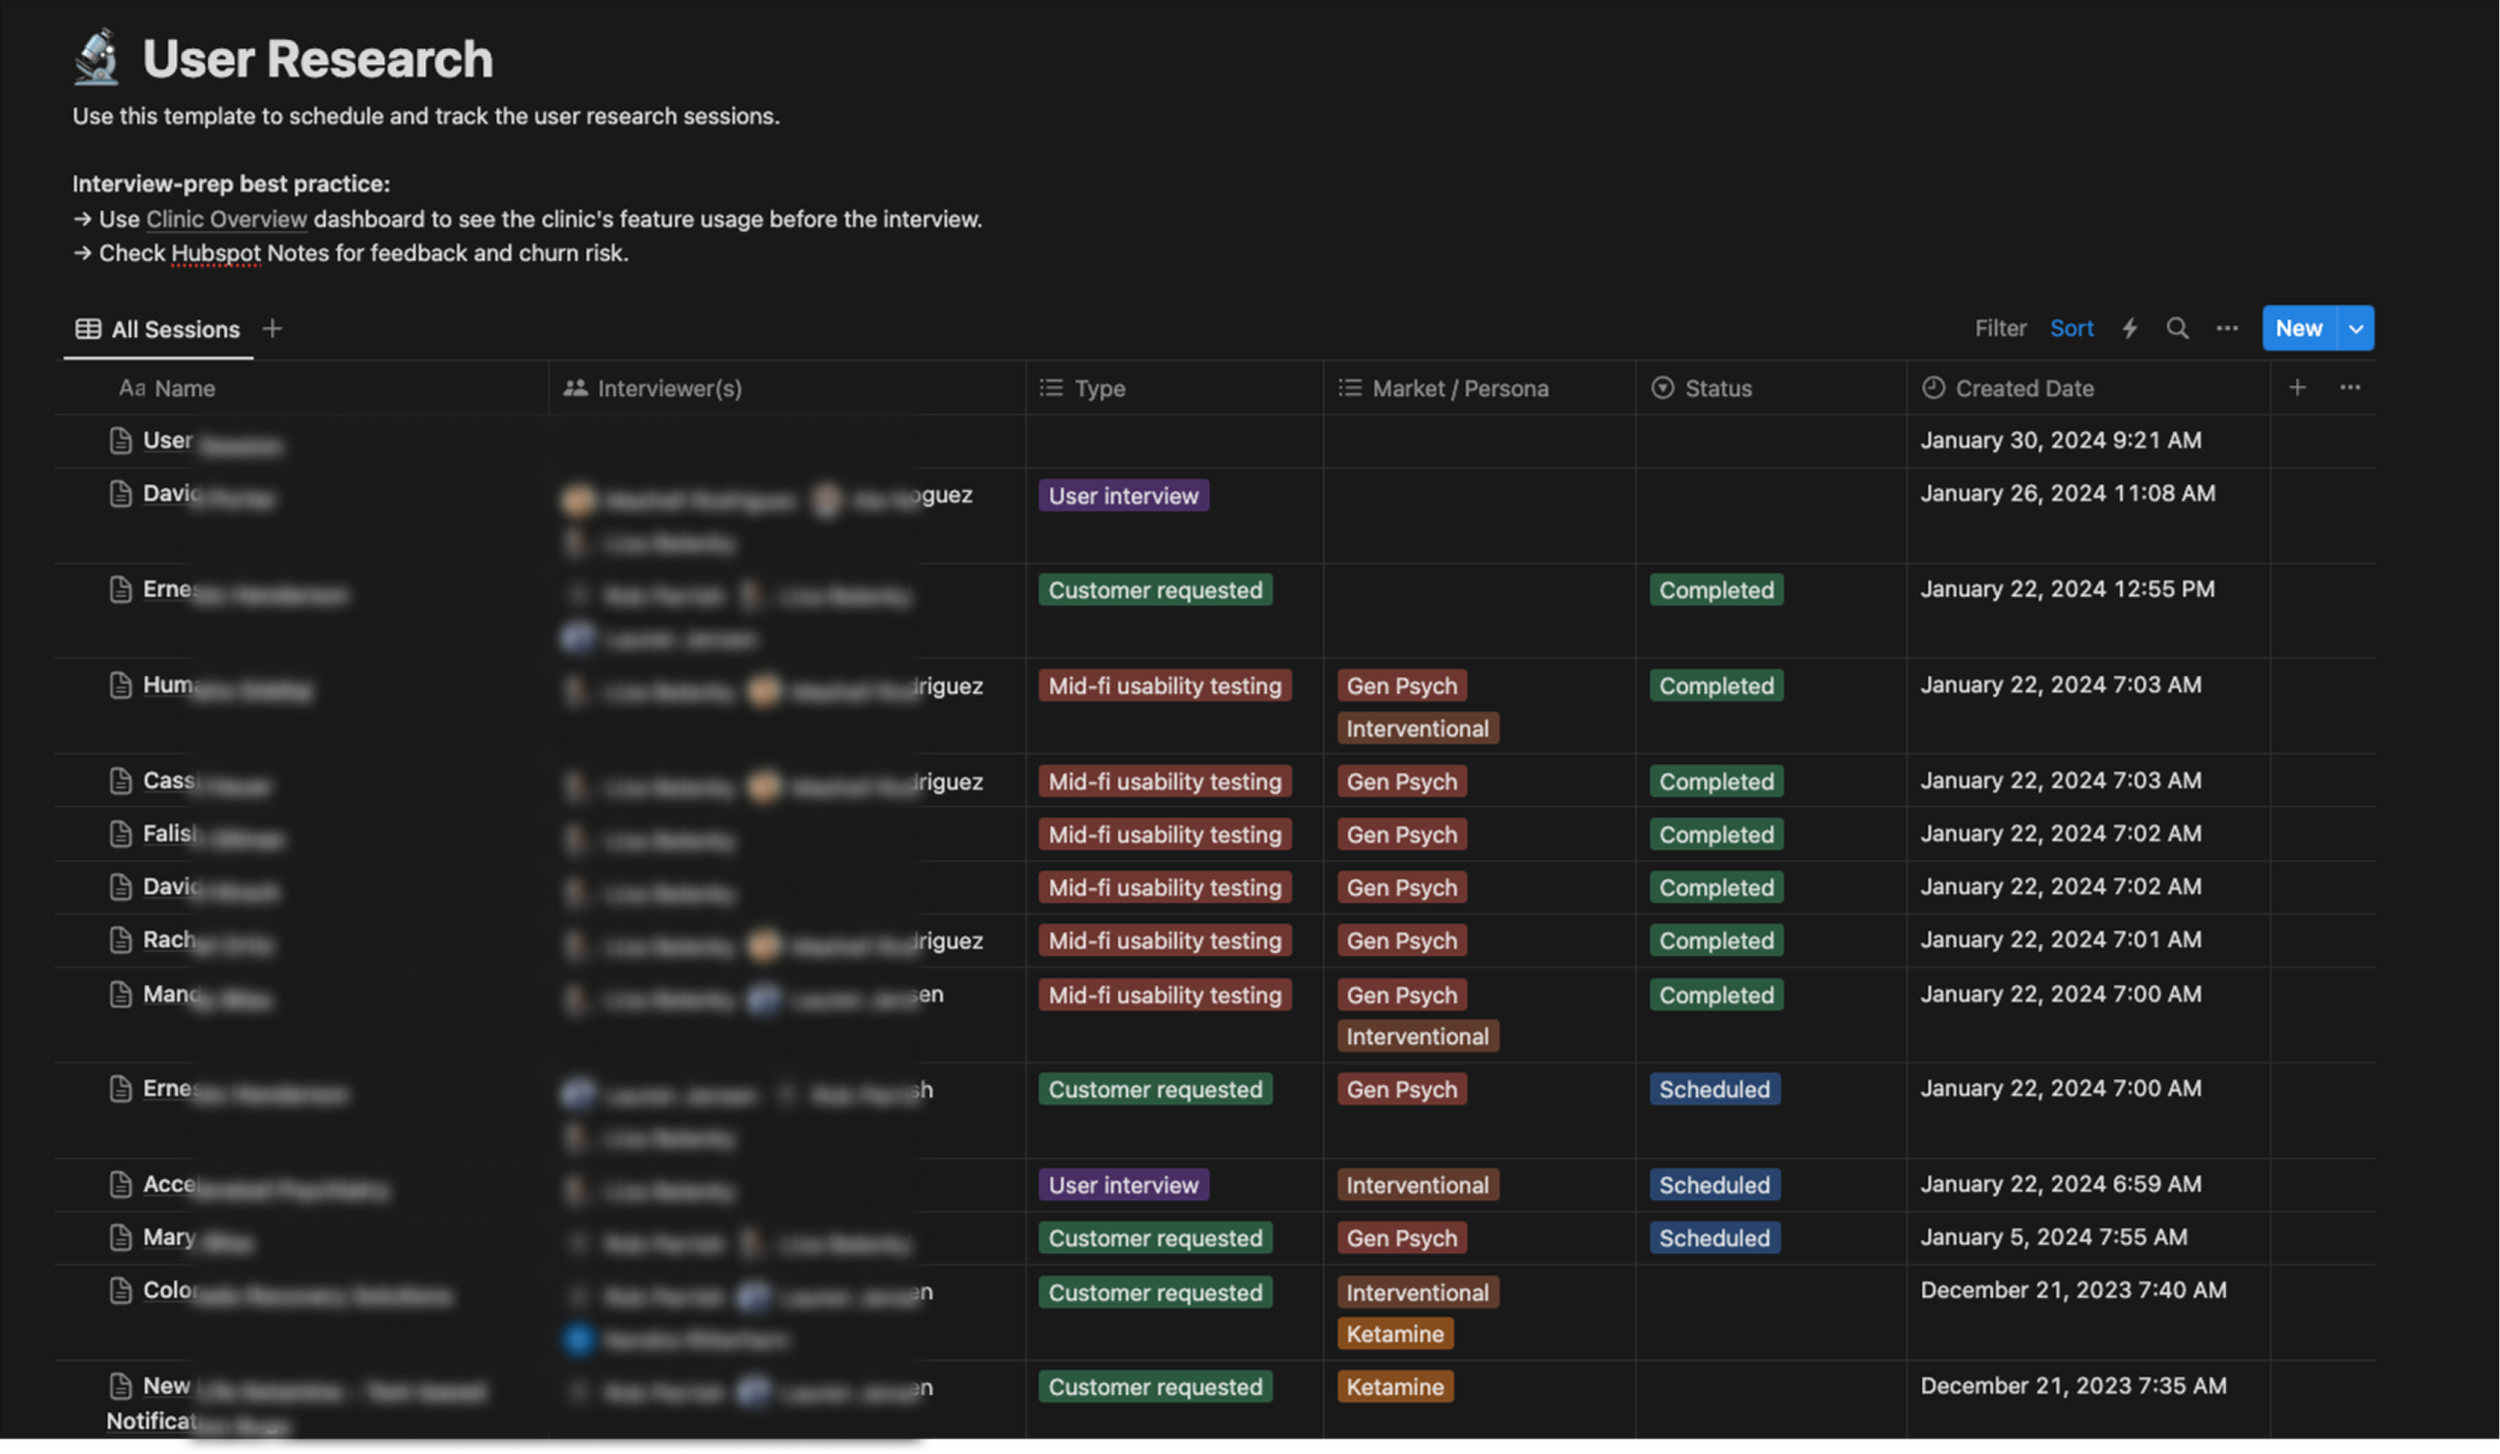
AI Clinical Charting for Mental Health
Osmind provides an electronic health records platform for behavioral health clinicians managing complex patient cases such as treatment resistance depression.
I redesigned the clinical charting experience from a dense, form-heavy interface to a AI content-first editor. balancing clinician usability with structured data requirements for life sciences partnership.
With AI-powered ambient documentation, I was able to reduce charting time by 67%, and reduced at risk accounts by 20%.
Year
2024
My Role
Product Strategy
UI/UX Design
Research
Prototyping
Design Systems
Project Overview
The problem
Osmind was experiencing significant churn from newly onboarded psychiatrists. After some initial investigating and conversations with CX, I found that clinical charting was a major pain point as providers spent more time documenting than treating patients.
Through initial interviews and sifting through gong calls I found that:
The Current UI was Overwhelming: It was a dense and form-heavy interface with outdated bootstrap components
Cognitive overload: Clinicians had to context-switch between patient conversation and critical information
Time sink: Average of 15-25 minutes spent per patient note, clinicians were spending 2 hours daily on after-hours charting
Burnout contributor: Documentation burden cited as top reason for clinician dissatisfaction
Original charting
Opportunity
Design a flexible charting system that lets clinicians document how they want to based on their workflow, while still capturing the structured data required for our life sciences partnerships and clinical studies.
Research Phase
Methods used
While forms worked ok for Ketamine clinics, we were now broadening to psychiatrists. I wanted to understand how we could improve charting and new opportunities are there.
Shadowed 4 clinicians during mock patient sessions
Interviewed 12 providers across psychiatry and interventional care
Created Maze survey to understand what is the most and least relevant information in the note and how information should be organized.
Analyzed time-motion data on documentation workflows; used datadog to dive deeper on frustration events and recorded sessions
Partnered with data science to document exact structured data requirements
Mapped out workflows and user journeys.
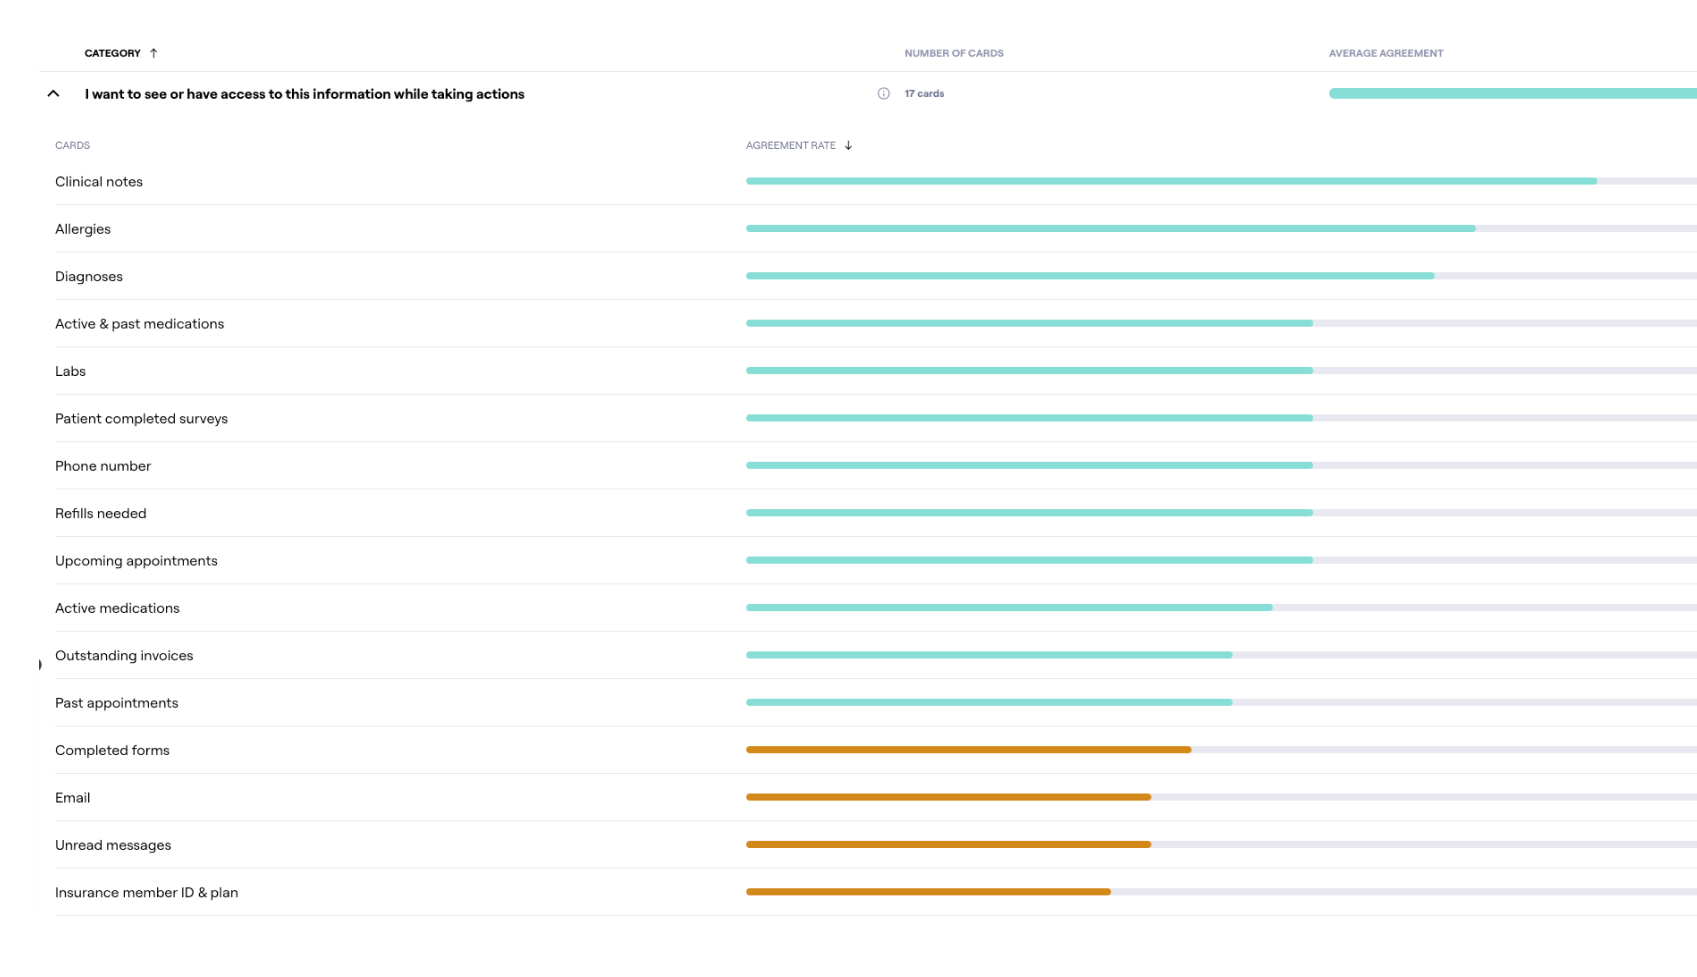
Maze survey to understand what information is needed for patient profile and a note
User interviews were continuous during this initiative
Key findings
Clinicians described splitting their attention between the patient and attempting to make notes. The current UI forced a choice between presence and documentation.
Different provider types had fundamentally different charting needs. General Psychiatrists needed free form narrative charting, medication changes, and longitudinal tracking while an Interventional psychiatrists needed protocol adherence, vitals, dosing, safety checklists for ketamine or TMS sessions.
Many clinicians used a mix of Word Documents and Dragon dictation to create notes. Then copy and paste into a note as a workaround.
Charting contributed to burnout and user friction to complete their entire workflow from creating an appointment to billing.
Iterations & Prototypes
Early ideas
Early ideas included a flexible form builder much like Hubspot or Typeform. While this would fix a lot of UX issues, clinicians still felt it was too rigid for how they wanted to create chart notes, In this phase I discovered that clinicians like the idea of creating their own templates ahead of a visit.
Data for life sciences
The data science team had strict requirements for discrete, structured data to support analytics, research partnerships, and life sciences collaborations (pharma companies, etc.). Data types included Demographics, Diagnoses, Psych Treatment, History, Current Treatment, and Outcomes. This wasn't optional, it was core to the business model.
New hypothesis
If we give clinicians a flexible rich-text editor with optional structured blocks they can insert when contextually relevant, they'll capture the data we need without feeling like they're filling out a form. Ideally wee can serve all workflow types with one system.
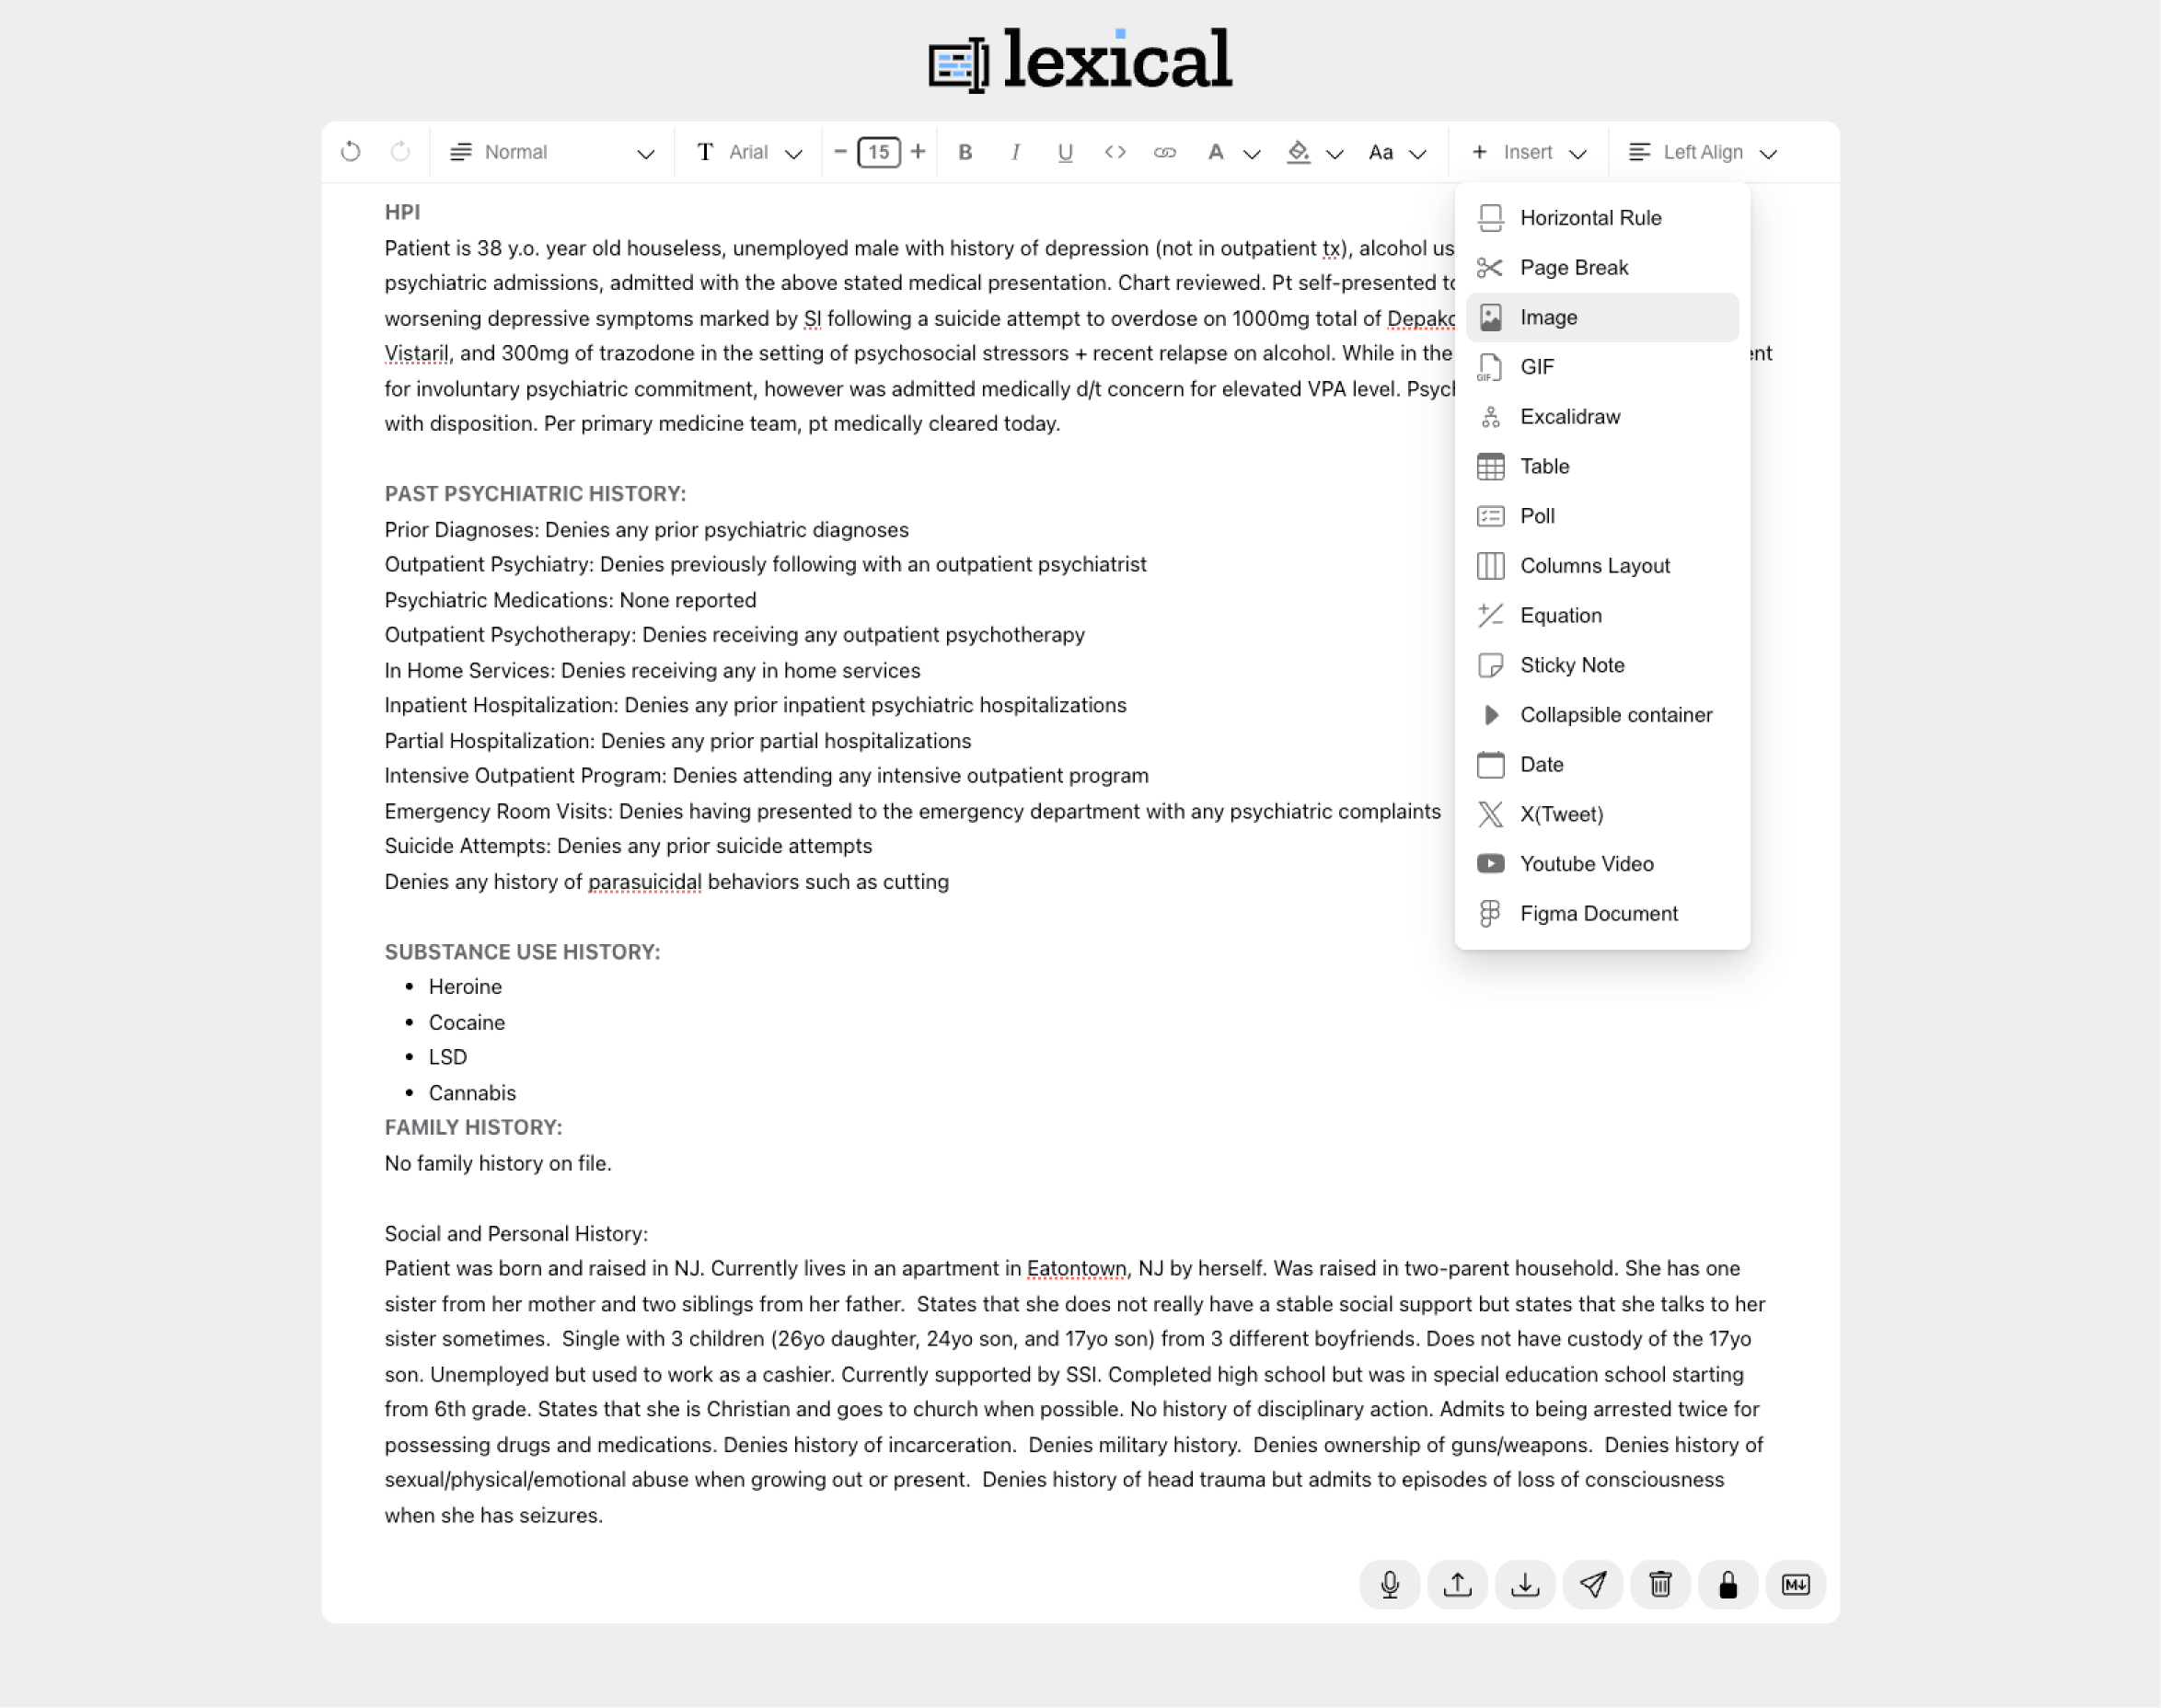
Testing prototype with lexical.dev
Before committing engineering resources, I needed to see how our clinicians interacted with a free form editor. I built a functional prototype using Lexical.dev(Meta's extensible text editor framework) and connected it to Claude Code to simulate the structured block insertion behavior, dictation, and transcriber.
With this early prototype I found that clinicians wanted to write freely, and the block-based insertion felt natural to them without being disruptive, especially if it was a pre-made template.
Design Solutions
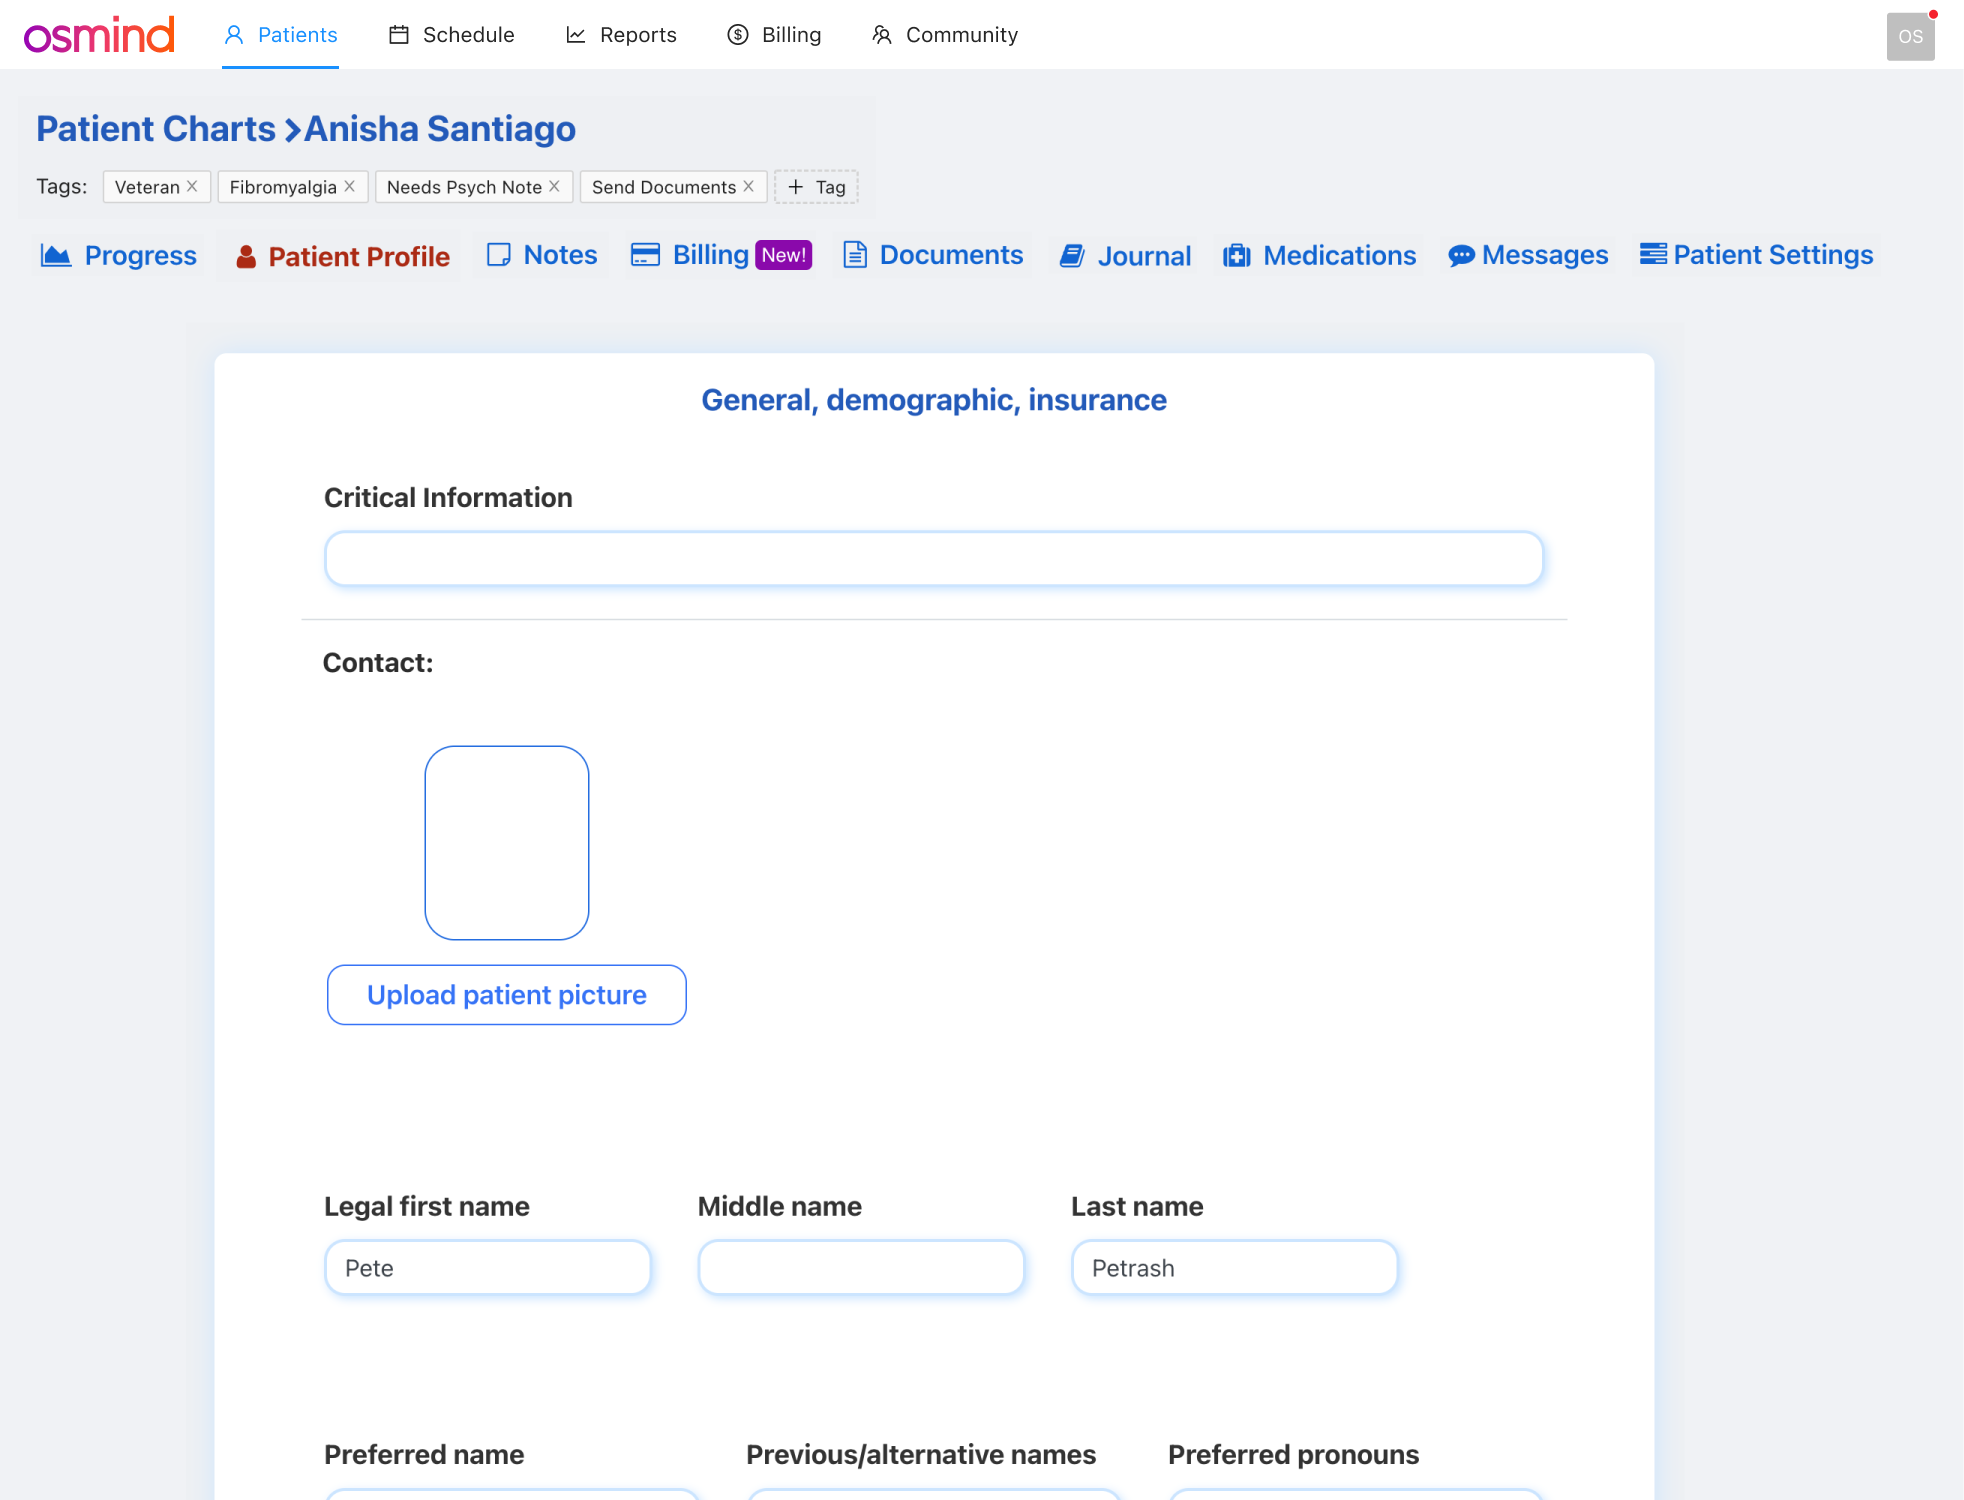
Persistent patient sidebar
Before: Patient info was buried in separate tabs and clinicians had to click away from the note to check allergies, medications, or when their last visit was.
After: A persistent left panel displays contact info, appointments, demographics, and insurance which are always accessible while charting but can be tucked away if needed. Clinicians stay in context without losing their place in the note.
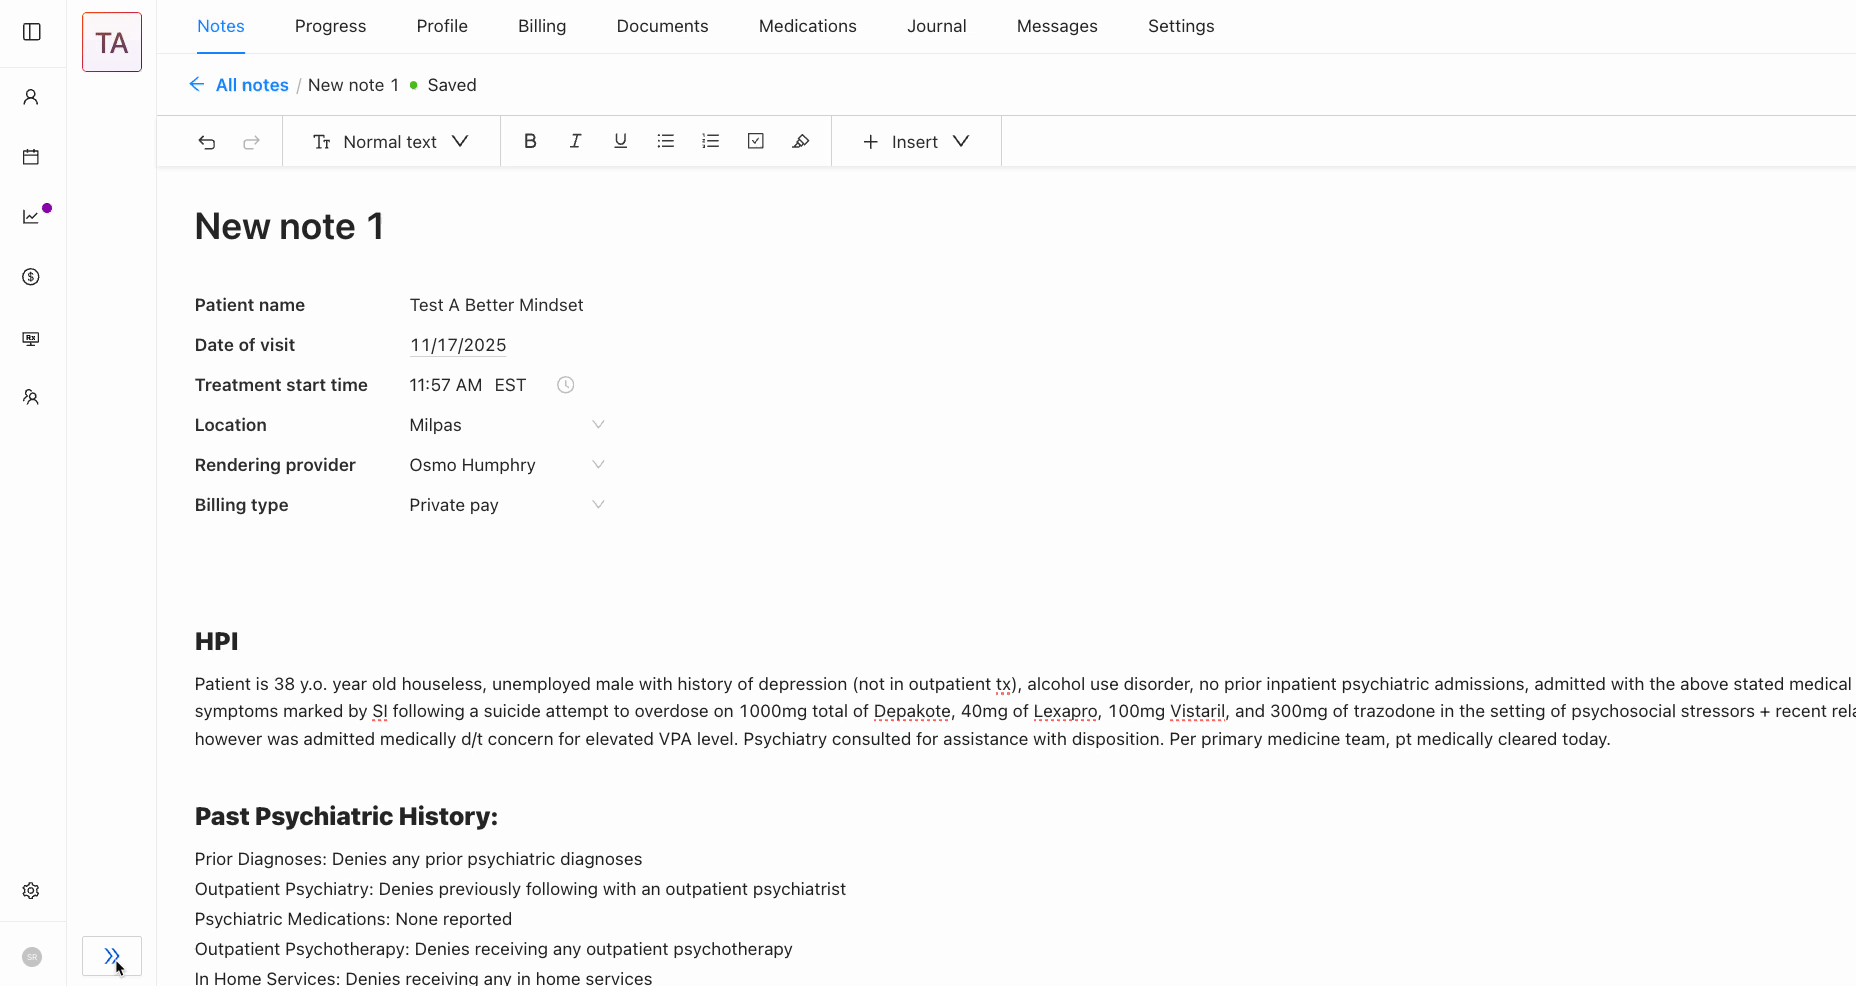
Flexible rich text editor with auto-save
A natural writing environment that adapts to different documentation styles.
Before: Clinicians had to manually save constantly. Lost connection meant lost work which created workarounds like drafting in external docs first.
After: Auto-save persists changes automatically with a subtle "Saved" indicator. Clinicians can focus on the patient, not on protecting their work.
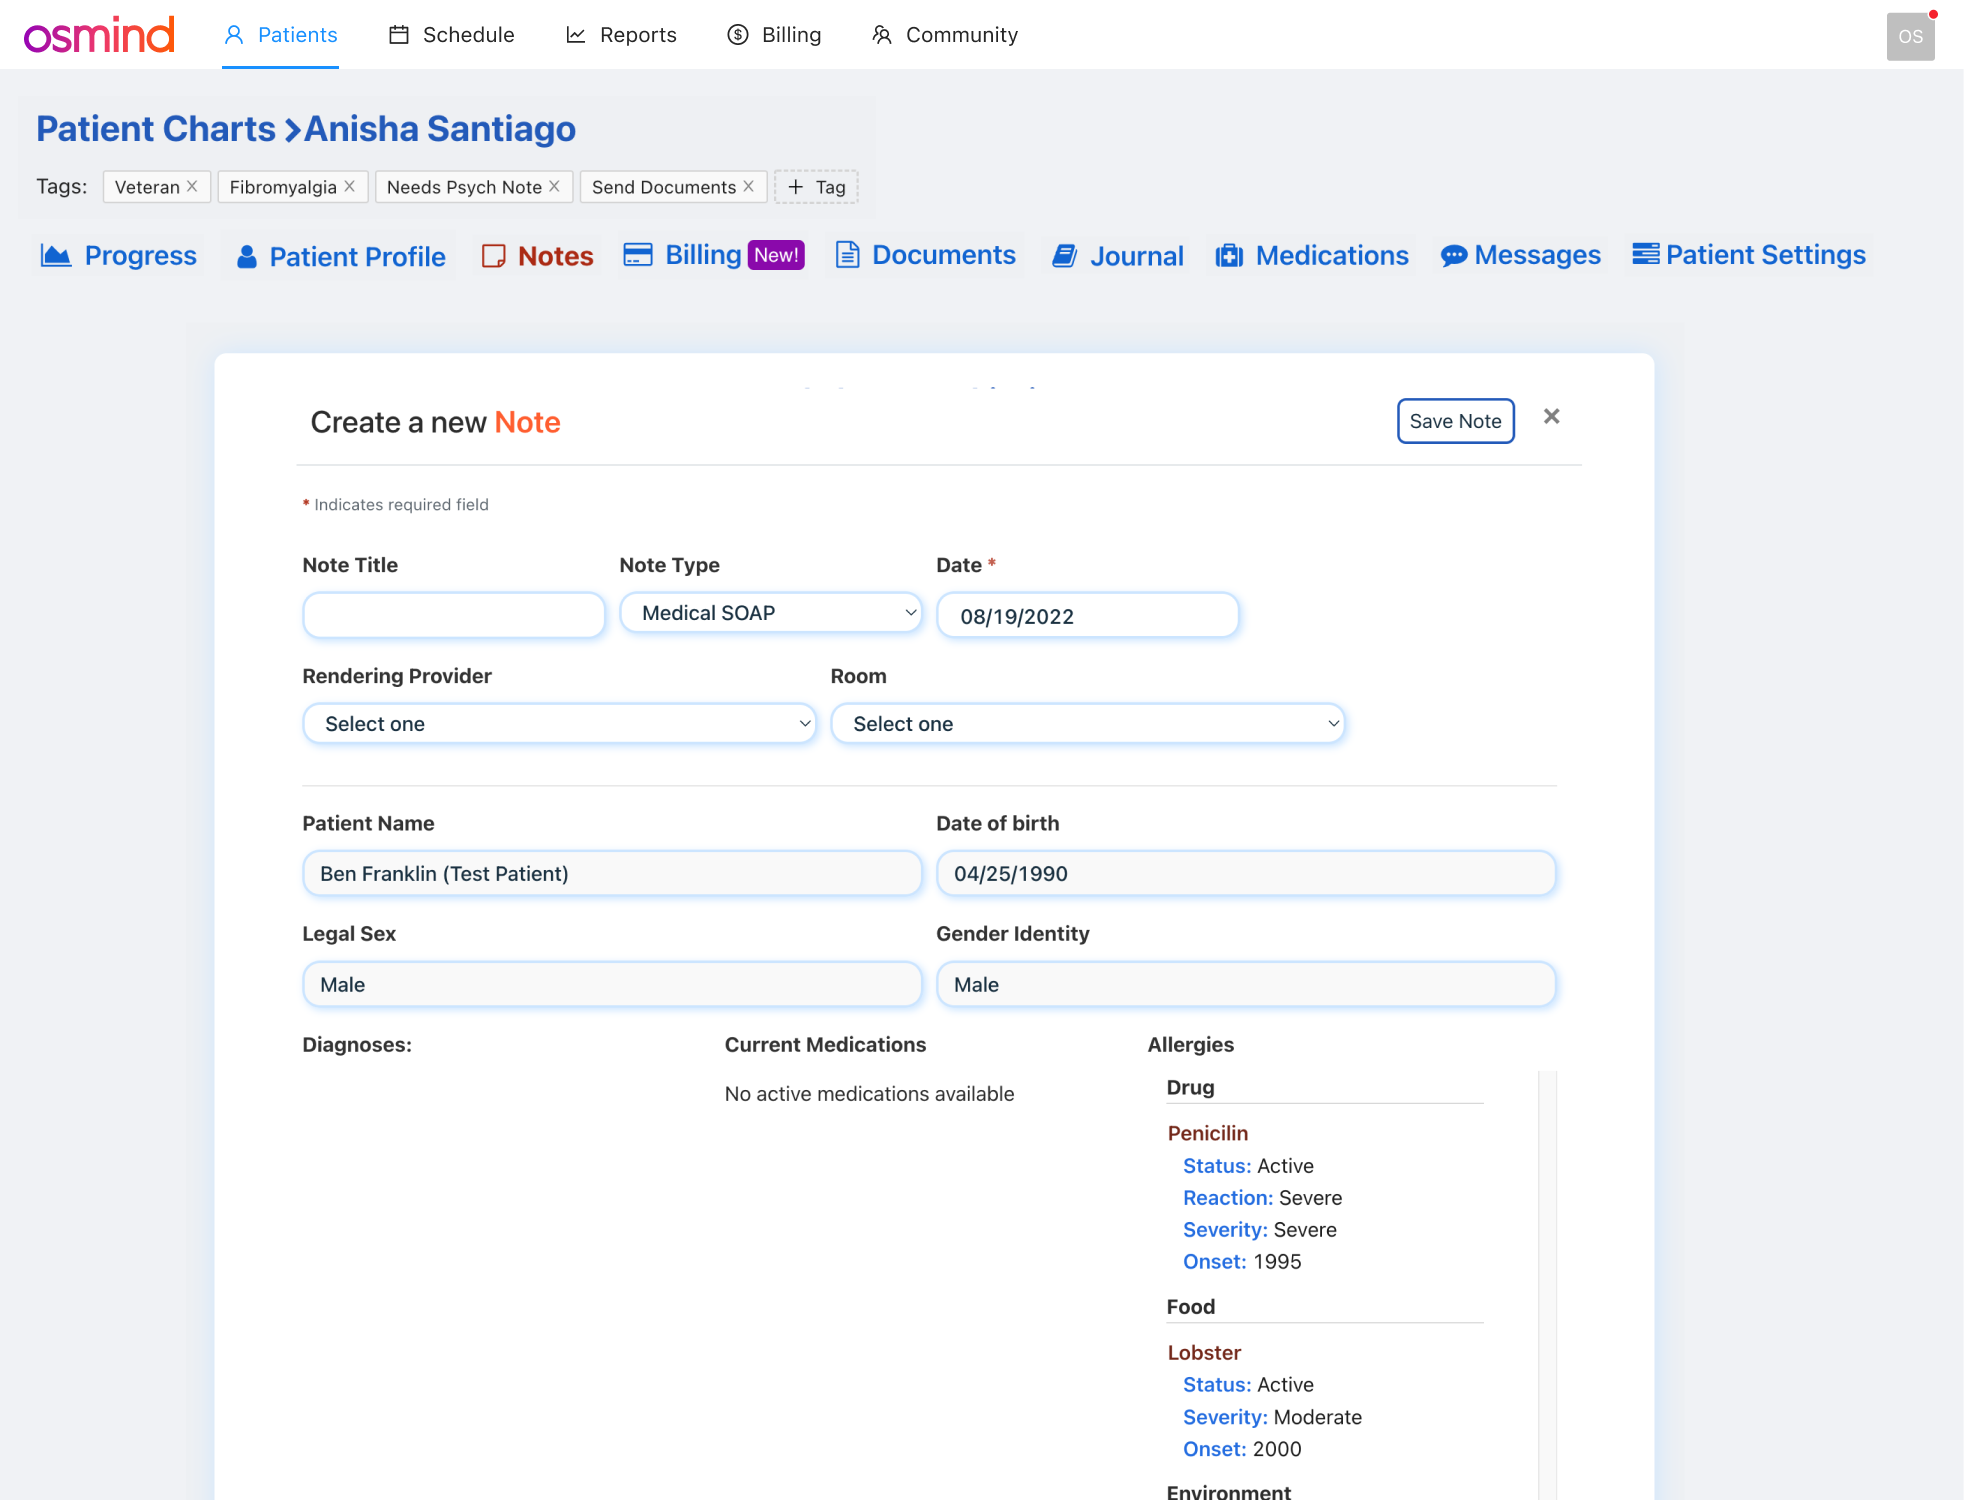
Structured data blocks
Insertable components that capture discrete data within the natural note flow, no separate forms required. Clinicians access them via a quick "+ Insert" menu with options like active medications, active allergies, active diagnoses, and patient intake responses. Workflow-specific blocks are also available for vitals, dosing records, and questionnaires. All data is structured for downstream use by data science and research partnerships.
Why structured input over LLM extraction? Clinician-entered data is a clinical assertion with clear provenance. LLM-inferred data is an interpretation, which is less defensible for research and regulatory purposes.
Quick actions connecting to the wider EHR
One-click access to related workflows without leaving the note. Clinicians can create a claim or invoice with pre-filled information from the encounter, order medications or labs, generate referral letters, and link to billing codes. Charting becomes the hub, not a dead end.
Customizable templates
Clinicians can create and save their own note templates tailored to their workflow, whether that's a ketamine intake, therapy follow-up, or medication check. This reduces repetitive setup for common visit types, ensures consistency across similar encounters, and supports clinic-wide standardization when needed.
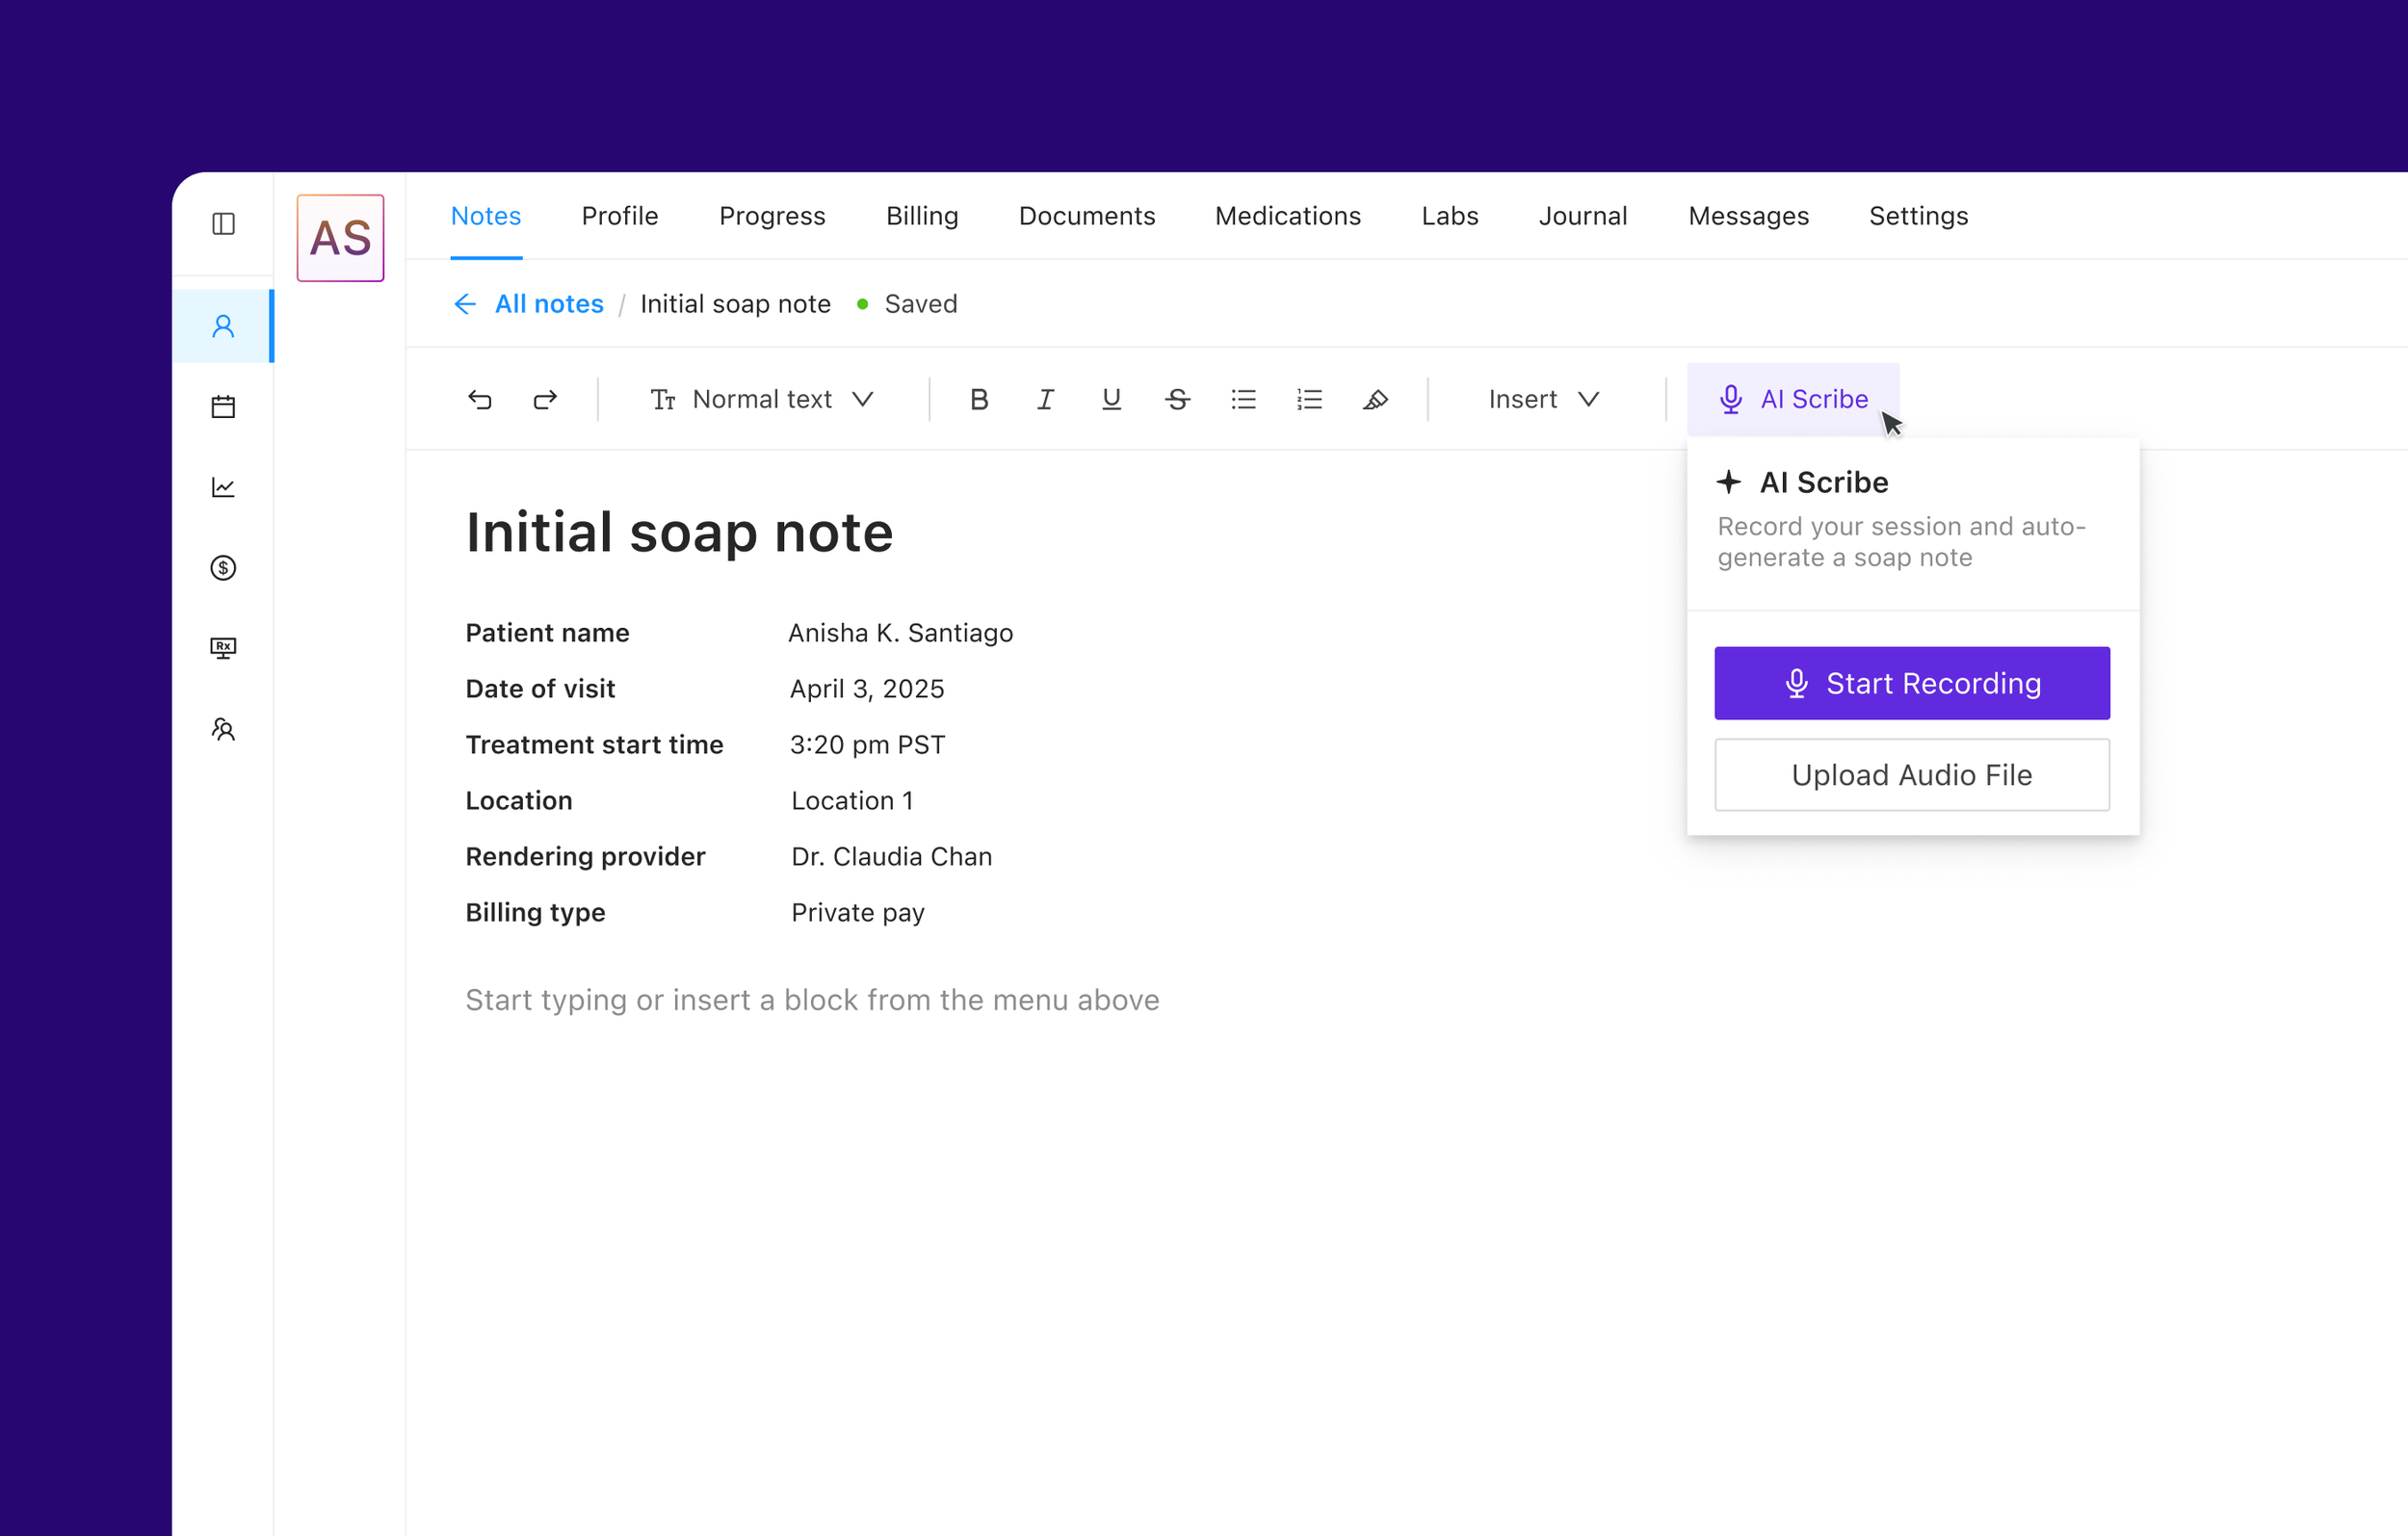
AI scribe integration (future state)
Ambient documentation leveraging whisper was tied into the new note experience. The system provides real-time transcription during sessions and auto-populates a standard soap note, which the clinician reviews and confirms before signing. Projected impact: reduce charting from 15–20 minutes to a 3–5 minute review. The clinician stays present with the patient and the note writes itself.
Results & Impact
67% Reduction
In reported charting time
$1.5M Pipeline
Increase due to showing new charting
10pt Increase
In NPS score post launch
20% reduction
In at risk churn accounts
What I Learned
Rapid experimentation worked
The Lexical + Claude Code prototype wasn't polished, but it was functional and gave us the ability to rapidly prototype concepts including transcription.
Constraints can unlock better solutions
The structured data requirement felt limiting at first, but it pushed us toward insertable blocks which was more elegant than "just forms" or "just free text" alone.